
Important
- Median Calculation – You will need to know how to calculate the median for the test.
- Mean Calculation – The mean is calculated by summing all the values and dividing by the total number of values.
- Standard Deviation and Variance Relationship – The standard deviation is the square root of the variance.
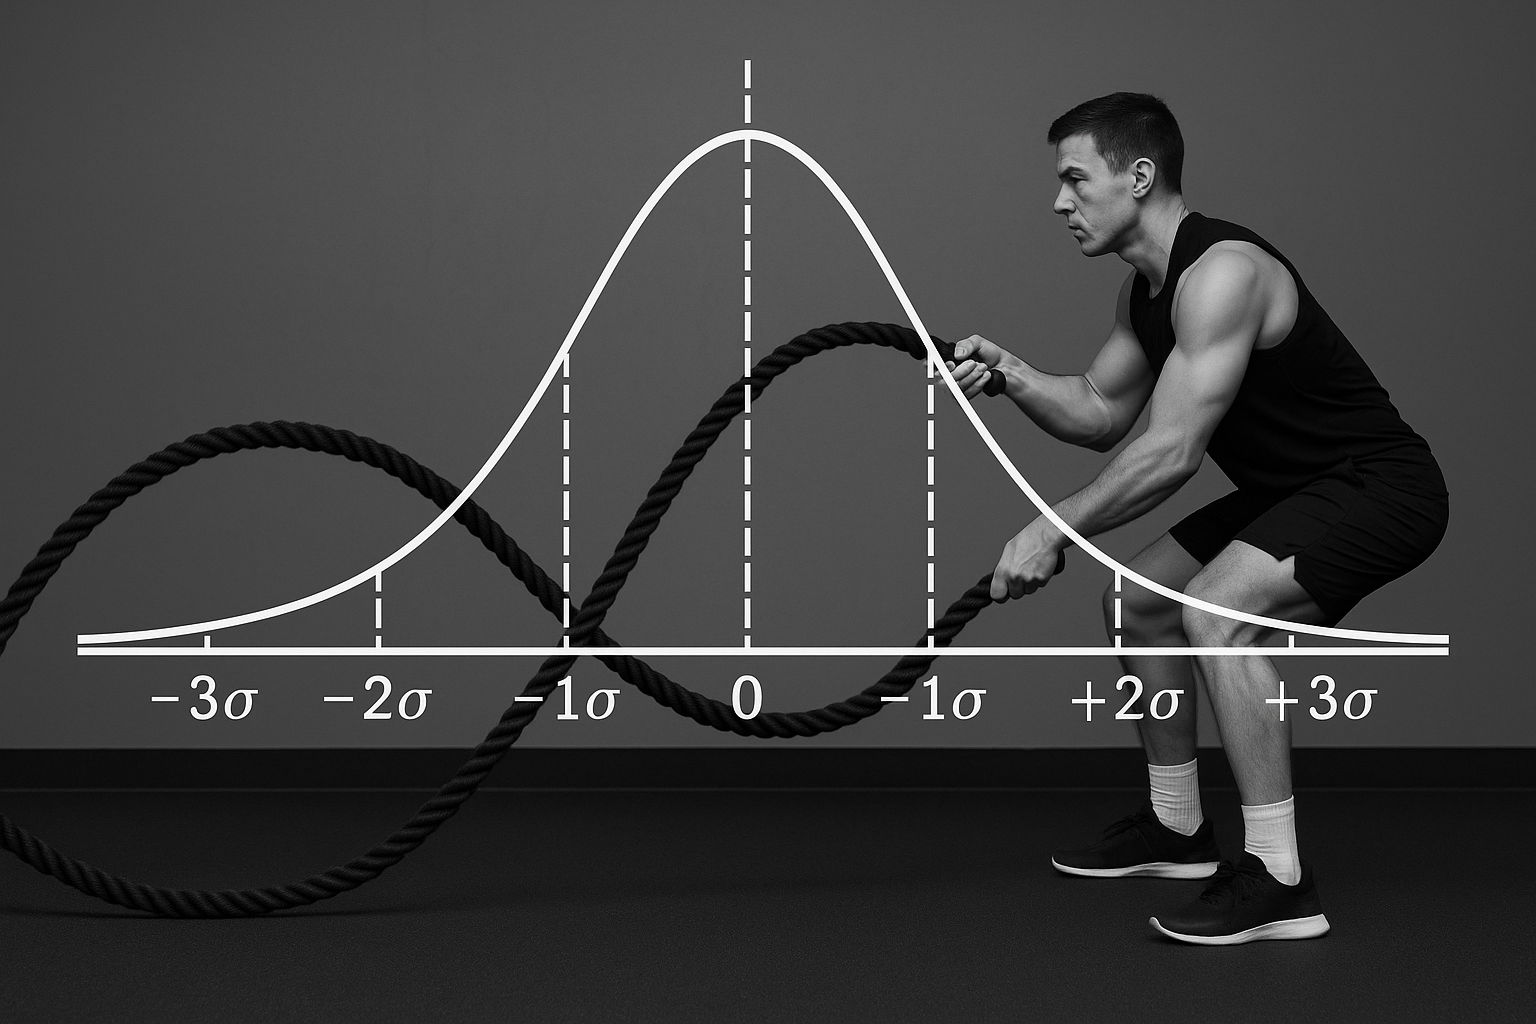
- Standard Deviation Definition – It is important to remember that the standard deviation represents, on average, how far a point is from the mean in the dataset.
- Chart Junk – Avoid unnecessary graphical elements that do not convey data; this is a key concept from data visualization.
- Distribution Shape and Central Tendency – The relationship between the mean, median, and mode indicates the skew of a distribution. For a symmetric distribution, mean ≈ median ≈ mode. For a positively skewed distribution, mode < median < mean. For a negatively skewed distribution, mean < median < mode.
- Descriptive Statistics for Assignment – Understanding concepts like mean, median, mode, skewness, and kurtosis is important for the first assignment, which involves producing descriptive statistics and visualizations.
Core Concepts
- Measures of Central Tendency: These are measures that relate to the centre of a distribution of scores. The three main measures are the mode (most common value), the median (middle value), and the mean (the arithmetic average). The choice between them depends on the data’s distribution and the presence of extreme values.
- Measures of Variability: These measures describe the degree to which scores are spread out or clustered around a central point. Key measures include the range (difference between maximum and minimum values), interquartile range (range of the middle 50% of scores), variance (the squared average distance from the mean), and standard deviation (the average distance from the mean).
- Properties of Distributions: Distributions can be described by their shape. Key characteristics are skewness, which measures the symmetry of the distribution (positive, negative, or zero/symmetric), and kurtosis, which describes the “tailedness” or peakiness of a distribution (platykurtic, leptokurtic, or mesokurtic).
- Degrees of Freedom (df): This is the number of data points that are free to vary when estimating a population parameter from a sample statistic. For sample variance, it is calculated as n-1 because once the sample mean is known, only n-1 scores can vary freely; the last score is fixed to ensure the sum of deviations from the mean equals zero.
- Boxplots: A boxplot is a graphical method for representing the dispersion of data. It visually displays the minimum, first quartile, median (second quartile), third quartile, maximum, and potential outliers, providing a clear picture of a variable’s spread and symmetry.
Theories and Frameworks
- Sum of Deviations Theorem: The sum of the deviations of scores from their mean will always equal zero. This mathematical property necessitates squaring the deviations to calculate variance, as the simple average deviation is uninformative.
Notable Individuals
- Student (William Sealy Gosset): While working at the Guinness factory, he invented the t-test and described different forms of kurtosis (platykurtic, leptokurtic, mesokurtic).
- Rembrandt & Picasso: Used as a qualitative example of variability in art; Rembrandt’s self-portraits were consistent over time (low variability) while Picasso’s were highly varied.
- S. S. Stevens: An influential psychologist who defined the four scales of measurement: nominal, ordinal, interval, and ratio.
- John Tukey: An influential statistician who developed exploratory data analysis (EDA), including the stem-and-leaf display and the boxplot.